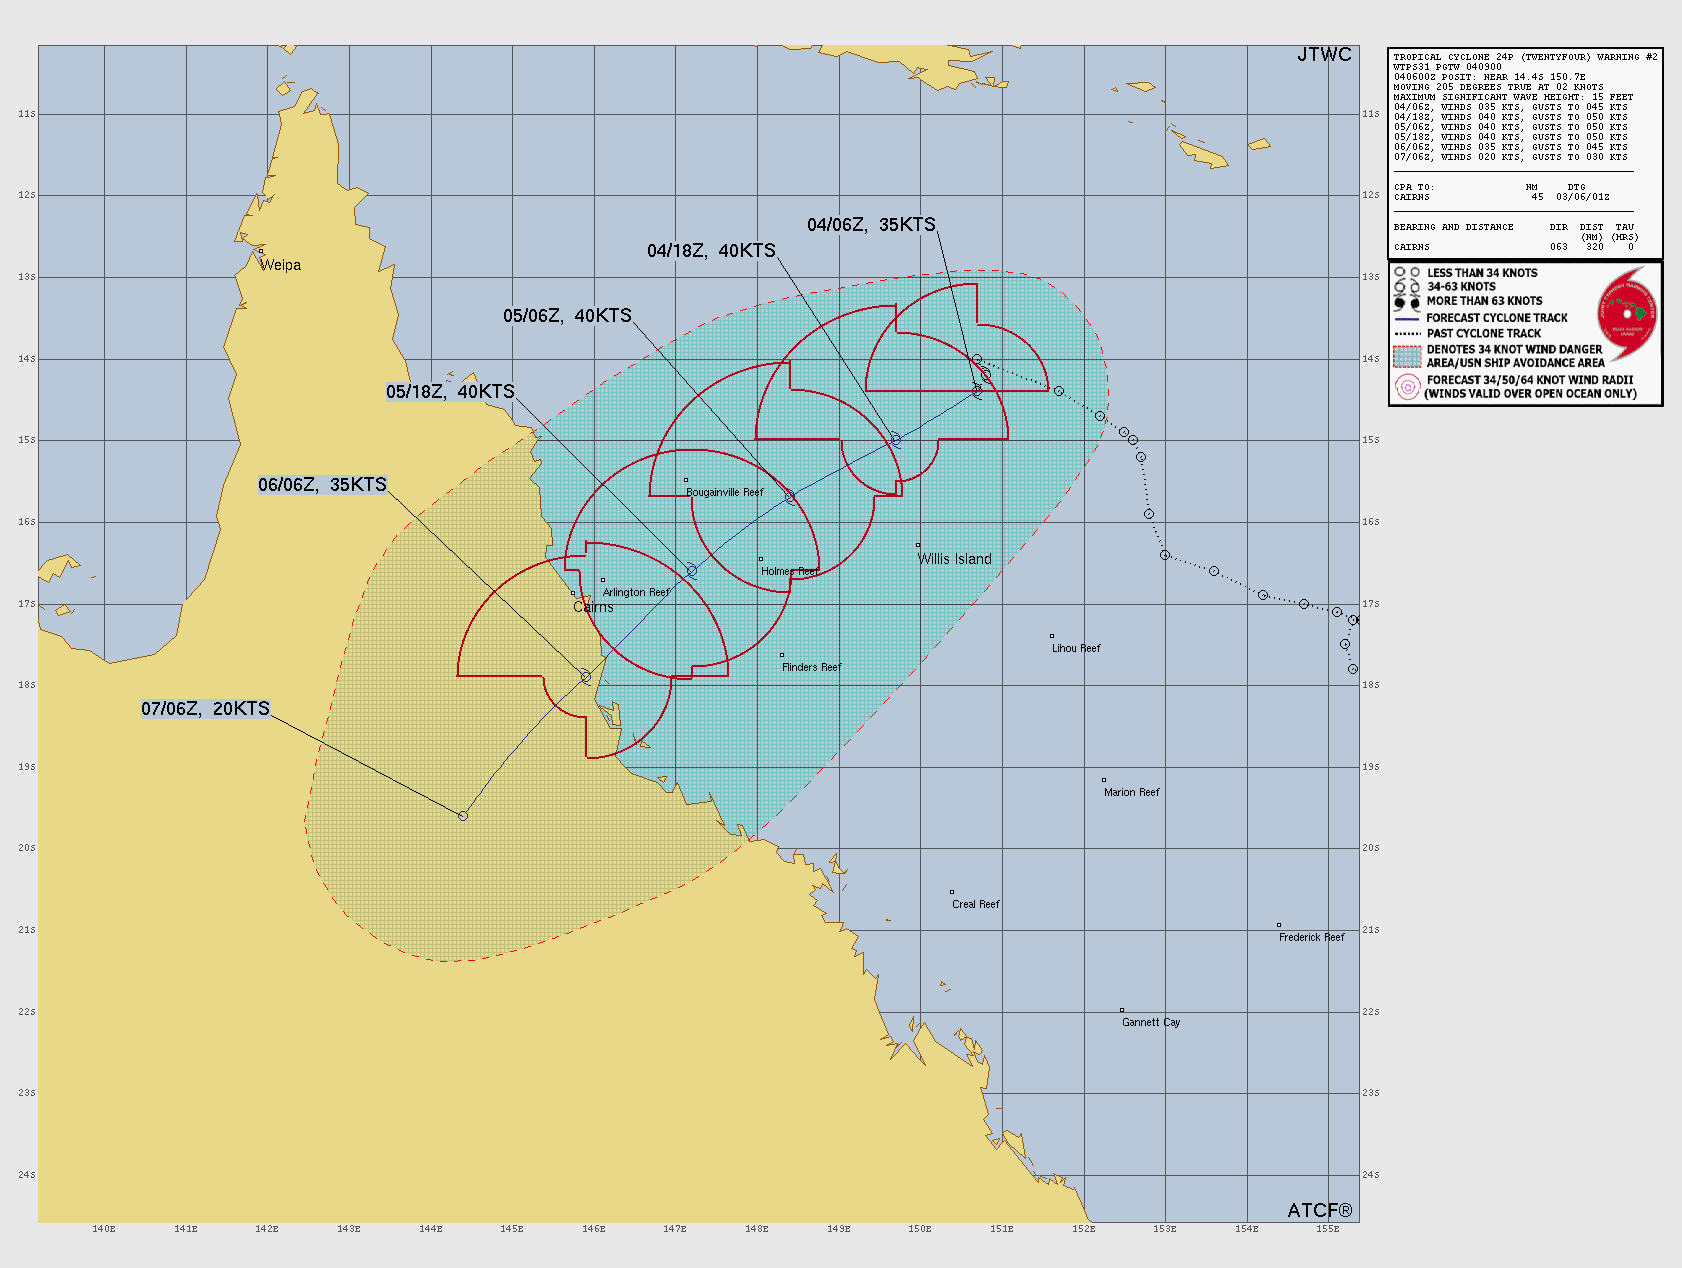
Subtropical Storm TWENTYFOUR
Updated March 09, 2026 at 18:00 UTC
Located at 27.6°S, 159.6°E
Minimum Pressure: 991 mb
Maximum Winds: 35 kt
Radius of Maximum Wind: 35 nm
Environmental Pressure: 1000 mb
Storm Radius: 200 nm
Formerly Invest 91P
Current Conditions


Forecasts


Storm History


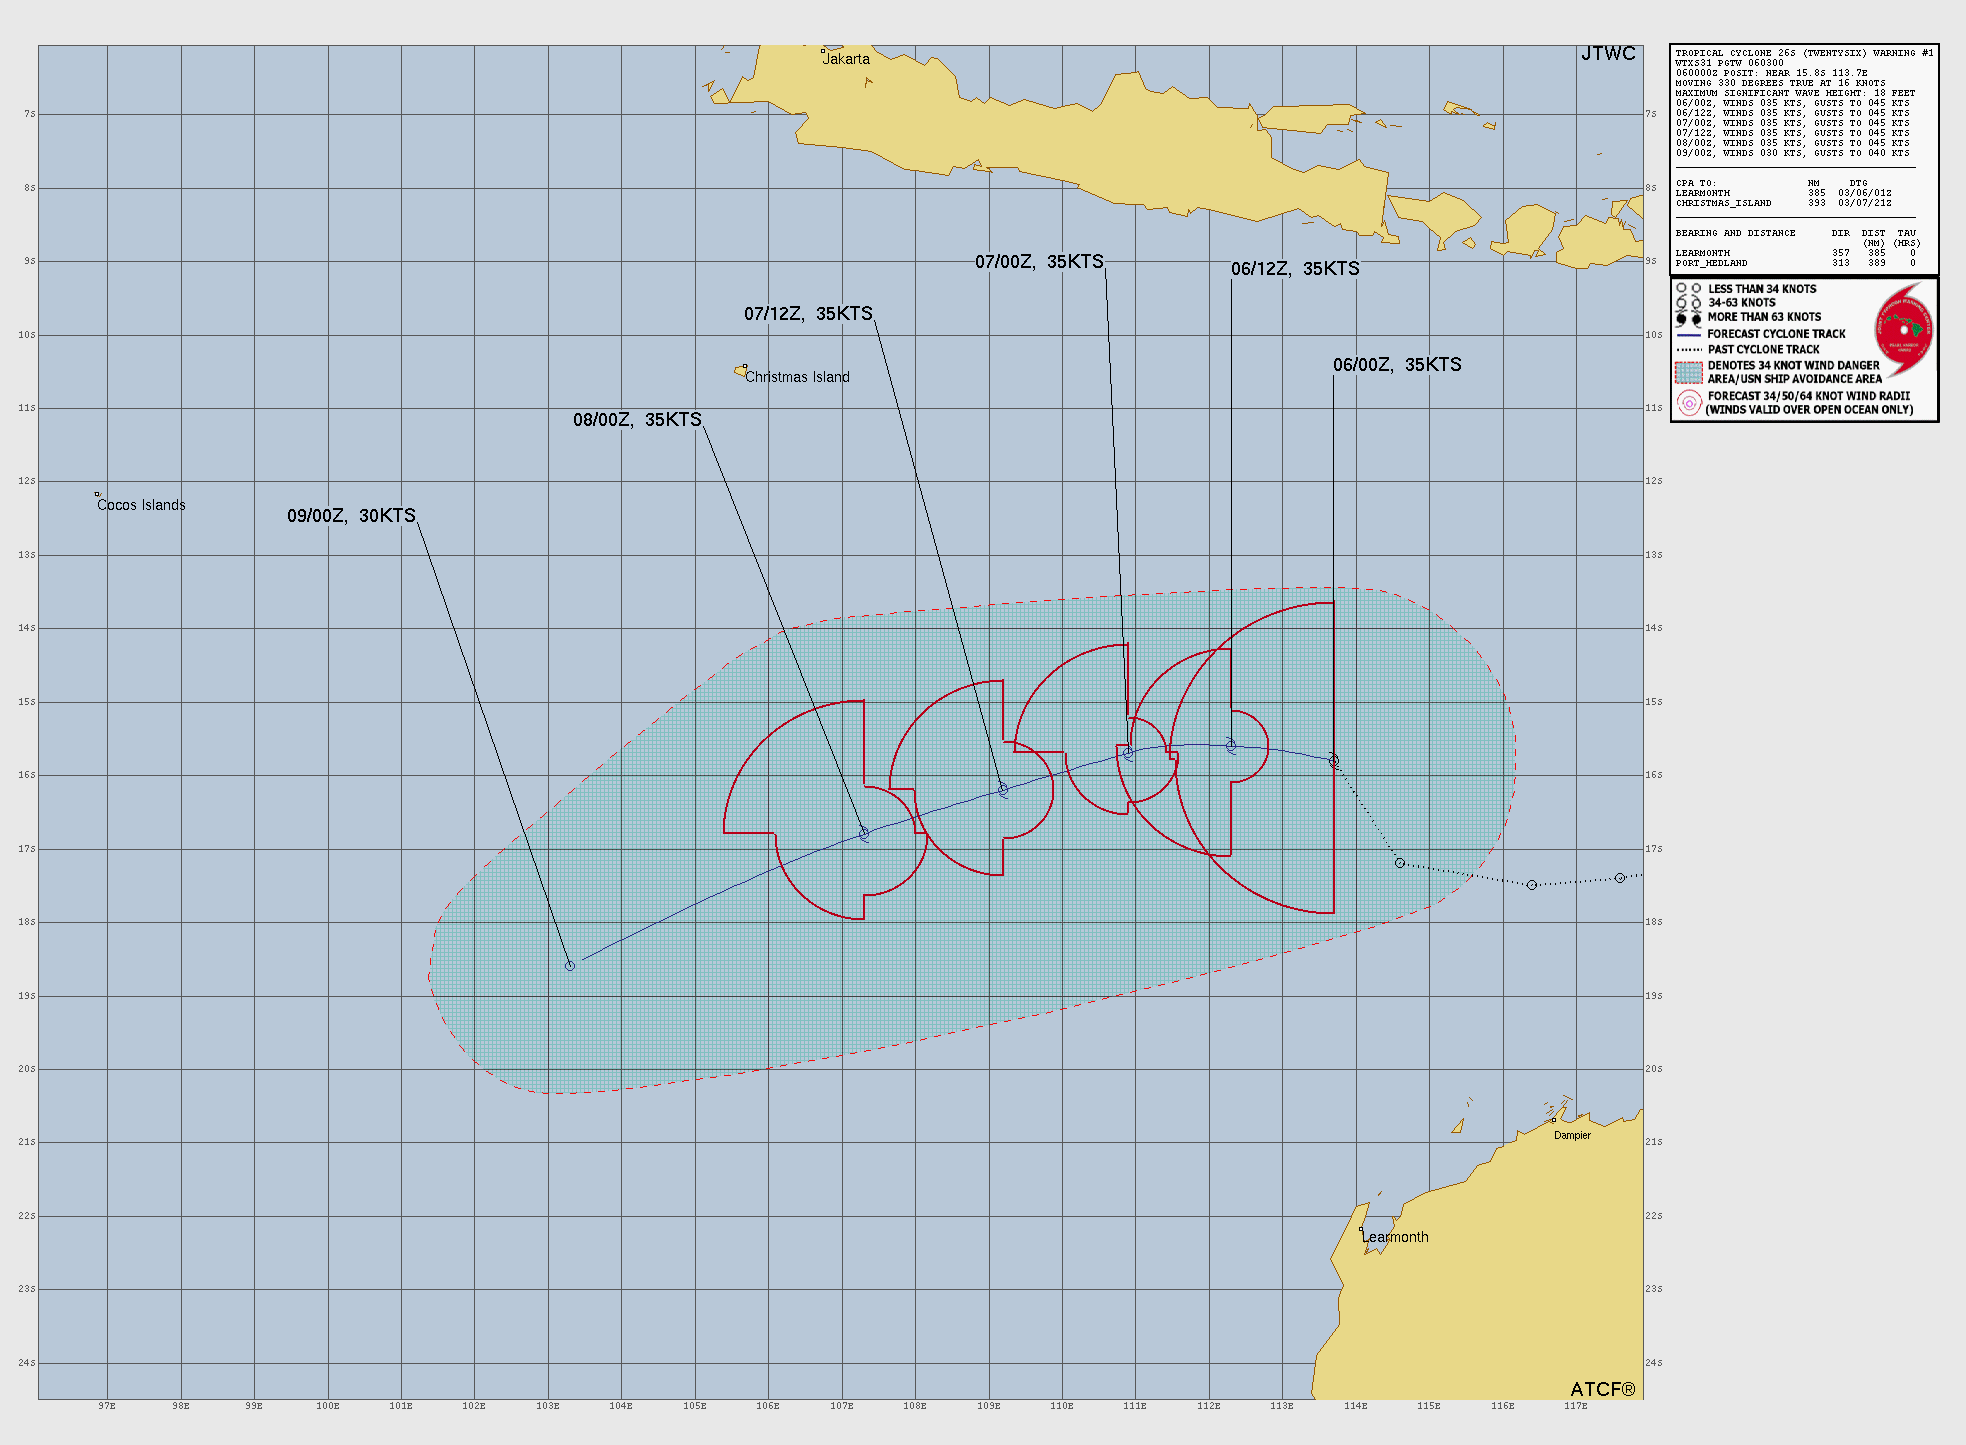
Tropical Depression TWENTYSIX
Updated March 09, 2026 at 18:00 UTC
Located at 17.9°S, 101.4°E
Minimum Pressure: 1002 mb
Maximum Winds: 25 kt
Radius of Maximum Wind: 75 nm
Environmental Pressure: 1008 mb
Storm Radius: 240 nm
Formerly Invest 93S
Current Conditions


Forecasts


Storm History


Invest 95W
Updated March 09, 2026 at 18:00 UTC
Located at 11.1°N, 137.6°E
Minimum Pressure: 1004 mb
Maximum Winds: 20 kt
Current Conditions


Forecasts


Storm History


Invest 96W
Updated March 09, 2026 at 18:00 UTC
Located at 13.7°N, 148.8°E
Minimum Pressure: 1005 mb
Maximum Winds: 20 kt
Current Conditions


Storm History


This page uses data from the National Hurricane Center (NHC) and Joint Typhoon Warning Center (JTWC), with best track files through the Automated Tropical Cyclone Forecast (ATCF) system. Microwave imagery courtesy of the U.S. Naval Research Laboratory.