Tropical Storm TWENTYSIX
Updated March 06, 2026 at 00:00 UTC
Located at 15.8°S, 113.7°E
Minimum Pressure: 997 mb
Maximum Winds: 35 kt
Radius of Maximum Wind: 100 nm
Environmental Pressure: 1004 mb
Storm Radius: 400 nm
Formerly Invest 93S
Current Conditions


Forecasts


Storm History


Tropical Storm KELI
Updated July 30, 2025 at 12:00 UTC
Located at 13.6°N, 154.7°W
Minimum Pressure: 1007 mb
Maximum Winds: 35 kt
Radius of Maximum Wind: 20 nm
Environmental Pressure: 1012 mb
Storm Radius: 100 nm
Formerly Invest 91C
Current Conditions


Forecasts

Storm History


Tropical Depression TWENTYFIVE
Updated March 06, 2026 at 00:00 UTC
Located at 14.2°S, 121.2°E
Minimum Pressure: 1001 mb
Maximum Winds: 30 kt
Radius of Maximum Wind: 15 nm
Environmental Pressure: 1003 mb
Storm Radius: 70 nm
Formerly Invest 90S
Current Conditions


Forecasts


Storm History


Remnants of KIKO
Updated September 11, 2025 at 00:00 UTC
Located at 24.3°N, 159.5°W
Minimum Pressure: 1009 mb
Maximum Winds: 30 kt
Radius of Maximum Wind: 40 nm
Environmental Pressure: 1013 mb
Storm Radius: 100 nm
Current Conditions


Forecasts

Storm History


Remnants of OCTAVE
Updated October 09, 2025 at 18:00 UTC
Located at 18°N, 109.6°W
Minimum Pressure: 1007 mb
Maximum Winds: 30 kt
Radius of Maximum Wind: 30 nm
Environmental Pressure: 1009 mb
Storm Radius: 60 nm
Current Conditions


Forecasts

Storm History


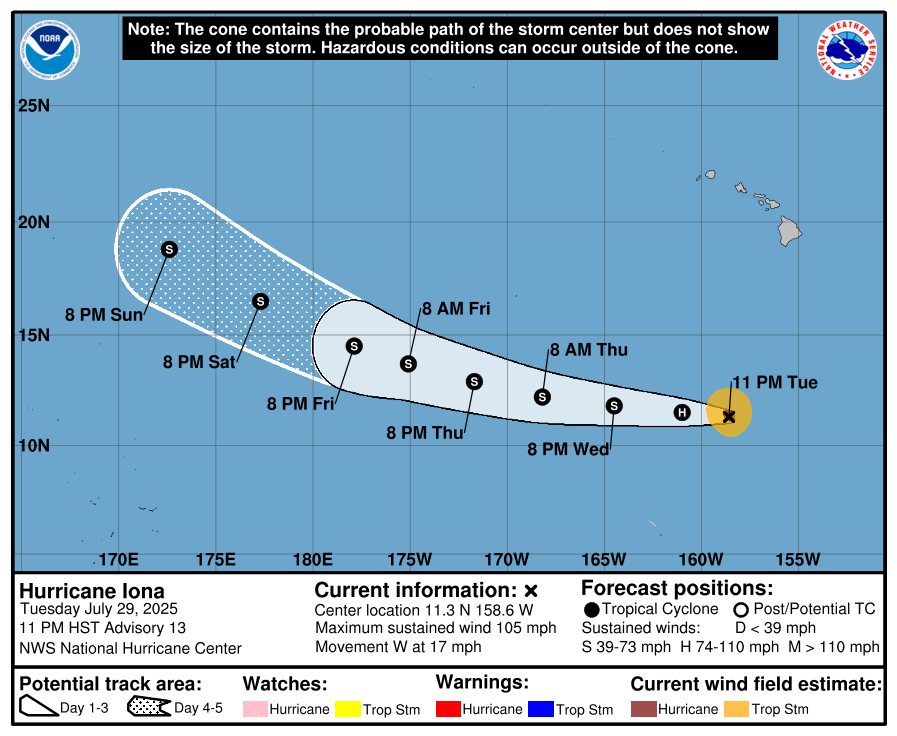
Tropical Depression IONA
Updated August 01, 2025 at 12:00 UTC
Located at 13.8°N, 175.5°W
Minimum Pressure: 1007 mb
Maximum Winds: 30 kt
Radius of Maximum Wind: 30 nm
Environmental Pressure: 1011 mb
Storm Radius: 115 nm
Current Conditions


Forecasts
Storm History


Tropical Depression TWENTYFOUR
Updated March 06, 2026 at 00:00 UTC
Located at 16.5°S, 146.2°E
Minimum Pressure: 1000 mb
Maximum Winds: 25 kt
Radius of Maximum Wind: 35 nm
Environmental Pressure: 1002 mb
Storm Radius: 170 nm
Formerly Invest 91P
Current Conditions


Forecasts


Storm History


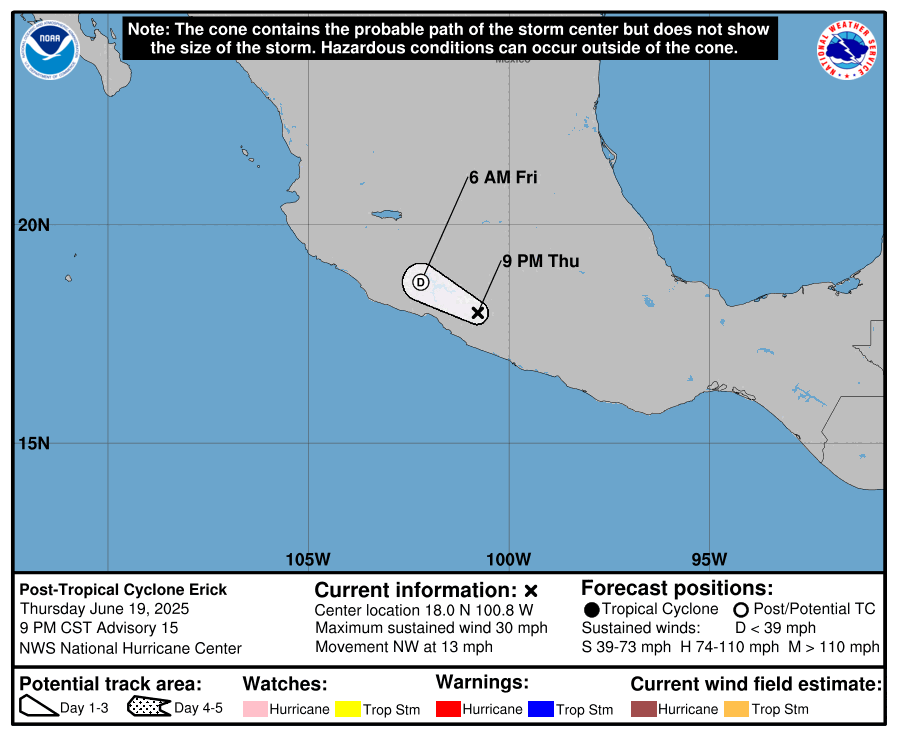
Tropical Depression ERICK
Updated June 20, 2025 at 00:00 UTC
Located at 17.8°N, 100.3°W
Minimum Pressure: 1006 mb
Maximum Winds: 25 kt
Radius of Maximum Wind: 10 nm
Environmental Pressure: 1009 mb
Storm Radius: 120 nm
Current Conditions


Forecasts
Storm History


Remnants of COSME
Updated June 11, 2025 at 18:00 UTC
Located at 16.5°N, 112.9°W
Minimum Pressure: 1008 mb
Maximum Winds: 25 kt
Radius of Maximum Wind: 25 nm
Environmental Pressure: 1012 mb
Storm Radius: 130 nm
Current Conditions


Forecasts

Storm History


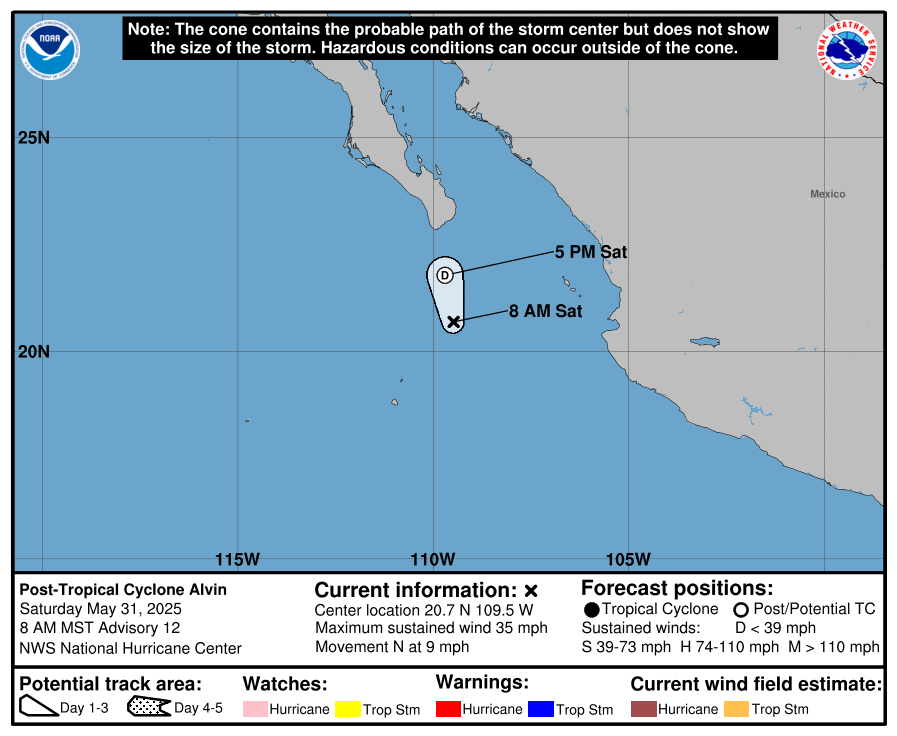
Remnants of ALVIN
Updated June 01, 2025 at 06:00 UTC
Located at 22.4°N, 109.4°W
Minimum Pressure: 1007 mb
Maximum Winds: 25 kt
Radius of Maximum Wind: 50 nm
Environmental Pressure: 1011 mb
Storm Radius: 120 nm
Current Conditions


Forecasts
Storm History


Remnants of HENRIETTE
Updated August 14, 2025 at 06:00 UTC
Located at 42.1°N, 168.4°W
Minimum Pressure: 1016 mb
Maximum Winds: 25 kt
Radius of Maximum Wind: 50 nm
Environmental Pressure: 1021 mb
Storm Radius: 100 nm
Current Conditions


Forecasts

Storm History


Remnants of GIL
Updated August 05, 2025 at 00:00 UTC
Located at 21.3°N, 143.4°W
Minimum Pressure: 1009 mb
Maximum Winds: 25 kt
Radius of Maximum Wind: 40 nm
Environmental Pressure: 1015 mb
Storm Radius: 190 nm
Current Conditions


Forecasts

Storm History


Remnants of RAYMOND
Updated October 12, 2025 at 12:00 UTC
Located at 24.5°N, 109.7°W
Minimum Pressure: 1006 mb
Maximum Winds: 25 kt
Radius of Maximum Wind: 35 nm
Environmental Pressure: 1008 mb
Storm Radius: 90 nm
Current Conditions


Forecasts

Storm History


Remnants of SONIA
Updated October 29, 2025 at 18:00 UTC
Located at 15.5°N, 127.8°W
Minimum Pressure: 1009 mb
Maximum Winds: 25 kt
Radius of Maximum Wind: 40 nm
Environmental Pressure: 1011 mb
Storm Radius: 60 nm
Current Conditions


Forecasts

Storm History


Remnants of IVO
Updated August 12, 2025 at 00:00 UTC
Located at 23.5°N, 121°W
Minimum Pressure: 1010 mb
Maximum Winds: 20 kt
Radius of Maximum Wind: 30 nm
Environmental Pressure: 1013 mb
Storm Radius: 100 nm
Current Conditions


Forecasts

Storm History


Remnants of NARDA
Updated October 01, 2025 at 00:00 UTC
Located at 21.7°N, 125°W
Minimum Pressure: 1012 mb
Maximum Winds: 20 kt
Radius of Maximum Wind: 60 nm
Environmental Pressure: 1013 mb
Storm Radius: 250 nm
Current Conditions


Forecasts

Storm History


Remnants of PRISCILLA
Updated October 12, 2025 at 00:00 UTC
Located at 26.5°N, 114.2°W
Minimum Pressure: 1007 mb
Maximum Winds: 20 kt
Radius of Maximum Wind: 60 nm
Environmental Pressure: 1009 mb
Storm Radius: 80 nm
Current Conditions


Forecasts

Storm History


Invest 92P
Updated March 06, 2026 at 00:00 UTC
Located at 14.1°S, 133.3°E
Minimum Pressure: 1002 mb
Maximum Winds: 15 kt
Current Conditions


Storm History


Invest 95W
Updated March 06, 2026 at 00:00 UTC
Located at 5.7°N, 146.4°E
Minimum Pressure: 1008 mb
Maximum Winds: 15 kt
Current Conditions


Storm History


Remnants of DALILA
Updated June 17, 2025 at 18:00 UTC
Located at 19.5°N, 114°W
Minimum Pressure: 1009 mb
Maximum Winds: 15 kt
Radius of Maximum Wind: 40 nm
Environmental Pressure: 1011 mb
Storm Radius: 150 nm
Current Conditions


Forecasts

Storm History


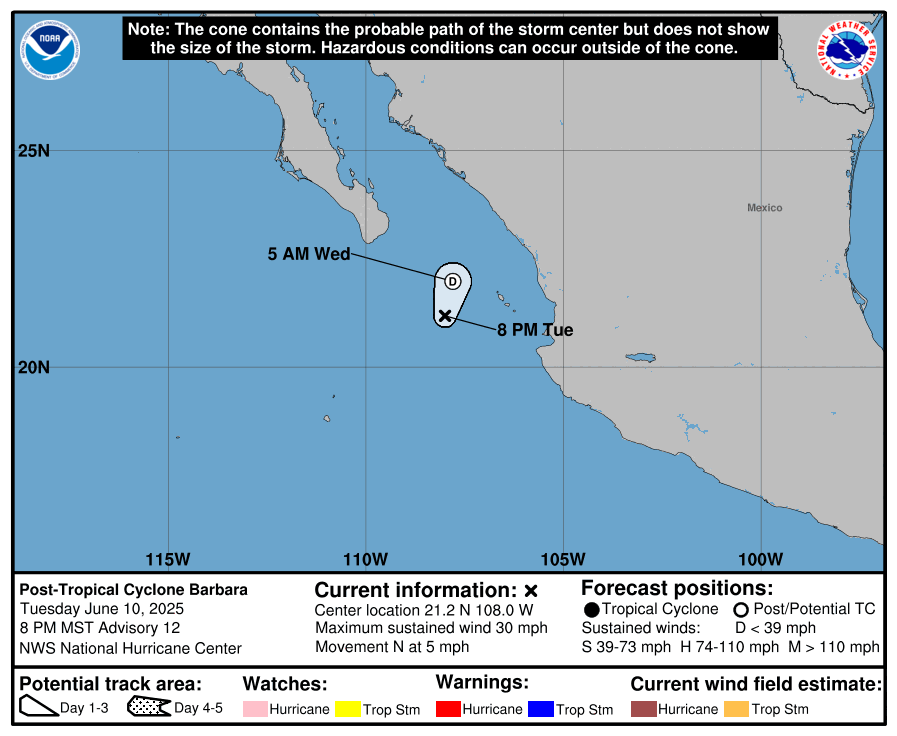
Remnants of BARBARA
Updated June 11, 2025 at 18:00 UTC
Located at 21.7°N, 107.2°W
Minimum Pressure: 1010 mb
Maximum Winds: 15 kt
Radius of Maximum Wind: 15 nm
Environmental Pressure: 1011 mb
Storm Radius: 80 nm
Current Conditions


Forecasts
Storm History


Remnants of FLOSSIE
Updated July 05, 2025 at 18:00 UTC
Located at 24.1°N, 118.5°W
Minimum Pressure: 1015 mb
Maximum Winds: 15 kt
Radius of Maximum Wind: 30 nm
Environmental Pressure: 1016 mb
Storm Radius: 140 nm
Current Conditions


Forecasts

Storm History


Remnants of JULIETTE
Updated August 30, 2025 at 00:00 UTC
Located at 25.3°N, 122.7°W
Minimum Pressure: 1013 mb
Maximum Winds: 15 kt
Radius of Maximum Wind: 70 nm
Environmental Pressure: 1014 mb
Storm Radius: 200 nm
Current Conditions


Forecasts

Storm History


Remnants of MARIO
Updated September 18, 2025 at 06:00 UTC
Located at 25°N, 119.6°W
Minimum Pressure: 1010 mb
Maximum Winds: 15 kt
Radius of Maximum Wind: 70 nm
Environmental Pressure: 1010 mb
Storm Radius: 130 nm
Current Conditions


Forecasts

Storm History


Remnants of LORENA
Updated September 07, 2025 at 06:00 UTC
Located at 26.1°N, 117°W
Minimum Pressure: 1009 mb
Maximum Winds: 15 kt
Radius of Maximum Wind: 30 nm
Environmental Pressure: 1010 mb
Storm Radius: 140 nm
Current Conditions


Forecasts

Storm History


This page uses data from the National Hurricane Center (NHC) and Joint Typhoon Warning Center (JTWC), with best track files through the Automated Tropical Cyclone Forecast (ATCF) system. Microwave imagery courtesy of the U.S. Naval Research Laboratory.